Question 1: How can we download the items (Infographics/Maps/Videos) from the website?
Answer 1: On the homepage of www.indiastatmedia.com you can choose the desired category and item, either from the selection platter or from clickable Infographics, Maps or Videos and the menu inside. On the right side of the image, various formats & sizes are mentioned; you can choose as desired and proceed to download them after making the payment.
Question 2: What is the difference between Infographics, Maps and Videos?
Answer 2: Infographics have readymade bar charts, pie-charts, graphs, animated Infographics and data cards on the economy, demographics, industry, elections, and other segments presented in a visually appealing manner.
In Maps, the data is presented in a nice geographical perspective about electoral and other socio-economic sectors. Elections results of various parliamentary and assembly constituencies of the country have been beautifully presented, which is useful for researchers, political parties and Psephologists.
Videos bring you stories woven with data form for your presentations and storytelling. You'd love these for these are loaded with all the data and information you need - from economy to demography to elections etc.
Question 3: How will the purchased item (Infographics/Maps/Videos) be delivered to us?
Answer 3: Upon successful payment, a pop-up on the screen will prompt you to save the item at the desired location on your computer/mobile. You can choose as desired.
Question 4: What are the different formats in which the data/items will be provided?
Answer 4: The infographics, charts are provided in pdf and jpeg formats; you can select from the menu the desired format. The videos will be in MP4 format only.
Question 5: What will be the sizes of the items?
Answer 5: There will be three categories in which the infographics will be provided.
Question 6: What are the different categories in which the data/items will be provided?
Answer 6: From elections to socio-economic, there will be many categories. Mentioned below are some.
Agriculture, Election Results, Demographics, Economy, Industries, Companies, Travel & Tourism, Education, Meteorological Data, Health, Lifestyle, Crime and Law, Mines & Minerals, and Infrastructure.
Question 7: Will the data shown in the chart/infographics be also shared?
Answer 7: Yes. The data is also provided without any additional cost. And like the item (Infographics/Maps/Videos), when you click on the download excel, there will be a pop on the screen, that will prompt you to save the item at the desired location on your computer/mobile in excel format.
Question 8: Is it necessary to be a subscriber and purchase plans to download the desired data?
Answer 8: Yes, you need to become a subscriber first to purchase the item (Infographics/Maps/Videos). But it's not necessary to purchase the plans to be able to buy a desired item. However, we’d suggest you purchase plans because they will be cost-effective as well as offer you ease to download desired items without logging in to the payment gateway every time.
Question 9: How will we get to know the source of the data?
Answer 9: After making the payment when you download the item the source of data will appear on the final item.
Question 10: Will there be any notification and record of the item purchased?
Answer 10: Yes. Every time you purchase any item you will get an email notification on your registered mail id, and you can check in the My Dashboard > My Download Details section.
Question 11: How will I know the history of payments made and plans purchased in past?
Answer 11: The history of your plans purchased can be seen under My Dashboard > My Subscription section.
Question 12: Will the unused balance in the account be allowed to be carried forward?
Answer 12: Yes. The carrying forward of the unused balance is allowed when the account is recharged within the validity period of the existing plan.
Question 13: How can we retrieve the password in case of losing it?
Answer 13: Just click the Forgot Password section and fill in the required details and you will be sent the details on your registered email id.
Question 14: Is this site accessible on both laptop and mobile?
Answer 14: Yes.
Question 15: Can the amount be refunded?
Answer 15: As a policy, indisatatmedia doesn’t return the amount once the purchase is made.
Question 16: What if the money is paid and the item isn’t downloaded?
Answer 16: If the item (Infographics/Maps/Videos) is purchased inadvertently and not downloaded (item and/or the data excel) the user can generate a request at support@indiastatmedia.com giving all details. Our team will investigate and after the claims are found correct, the technical team will approve them, and management shall take a decision. In such a case(s) the management will take seven or more working days to revert to the solution. For any query pertaining to a refund users can write to support@indiastatmedia.com. Depending on the case, the management will decide if the money will be refunded or given as a credit to purchase any other item from the website (www.indiastatmedia.com). The decision of the Site will be final and binding.
Question 17: What if the information/data/item I'm seeking isn’t available on the site or in the Infographics/Maps/Videos? And I need more charts/maps/videos?
Answer 17: In case you need more details in any chart/infographics/video, there is a section provided as Customization Request alongside Infographics/Maps/Videos. Upon clicking the Customization Request button, you will be prompted to furnish some details. Please share those details and submit the form.
You can also reach out to us through the Contact Us section sharing the details that you want. After analyzing your requirement our team will get back to you in 3-4 working days.
Question 18: In case of queries where we can contact you?
Answer 18: For any query, the user can write to support@indiastatmedia.com You can also write your query in the Contact Us section.

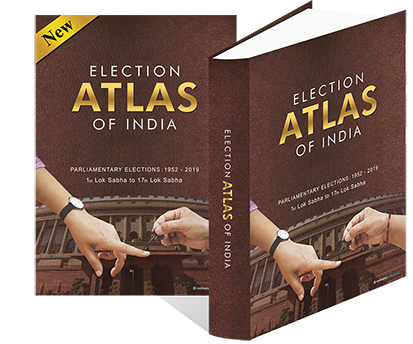
A first-of-its-kind Election Atlas of India which depicts a journey of progression of parliament elections since independence in the form of impressive graphs, charts and thematic maps...
more

Each Factbook contains details of a parliamentary constituency - from historic election results to demographic and electoral features...
more

Each Factbook contains details of an assembly constituency - from historic election results to demographic and electoral features...
more

Each Factbook contains detailed information about a district including socio-economic, industrial, elections and many other aspects. Of the 640 districts of India, the Factbooks of 620 districts are available...
more